ATR Trend FollowingThe script filters stocks on the basis of ATR. If the stock has moved above 7 times the ATR from the lows, the system generates buy signal and continues till the stock drops by 2 ATR. It is a good system in trending markets however in sideways consolidating markets, the system must be avoided. In trending markets it can generate good returns with significant Risk to Reward Ratio. Use it in confirmation with other trend depicting indicators is expected to generate better results.
"the script"に関するスクリプトを検索

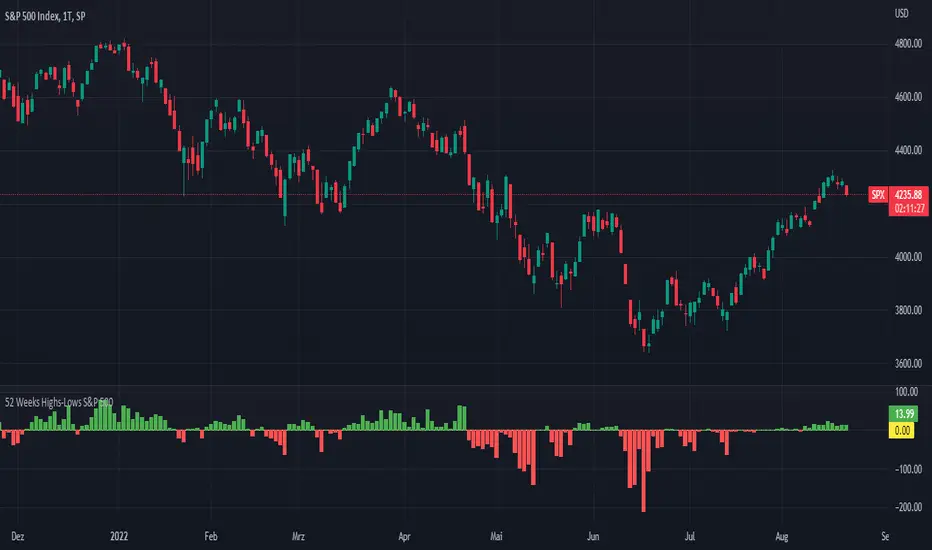
52 Weeks Highs-Lows S&P 500 - MugurThe script uses the MAHP and the MALP index and subtracts the second from the first. So you can see how many stocks in the S&P 500 make new highs or new lows on a 52 weeks basis and see the trend of the market.
5 Day Highs-Lows S&P 500 - MugurThe script uses the M5HP and the M5LP index and subtracts the second from the first. So you can see how many stocks in the S&P 500 make new highs or new lows on a 5 days basis and see the trend of the market.

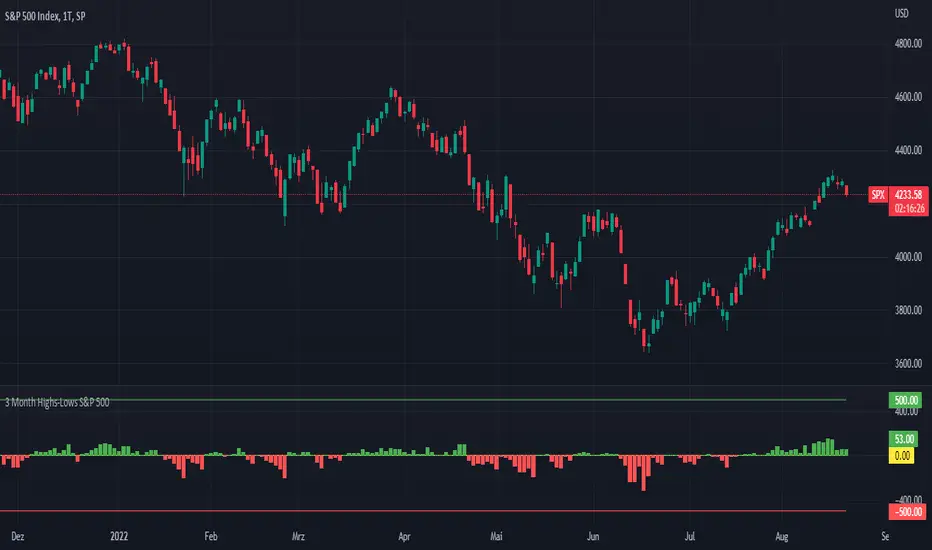
3 Month Highs-Lows S&P 500 - MugurThe script uses the M3HP and the M3LP index and subtracts the second from the first. So you can see how many stocks in the S&P 500 make new highs or new lows on a 3 month basis and see the trend of the market.
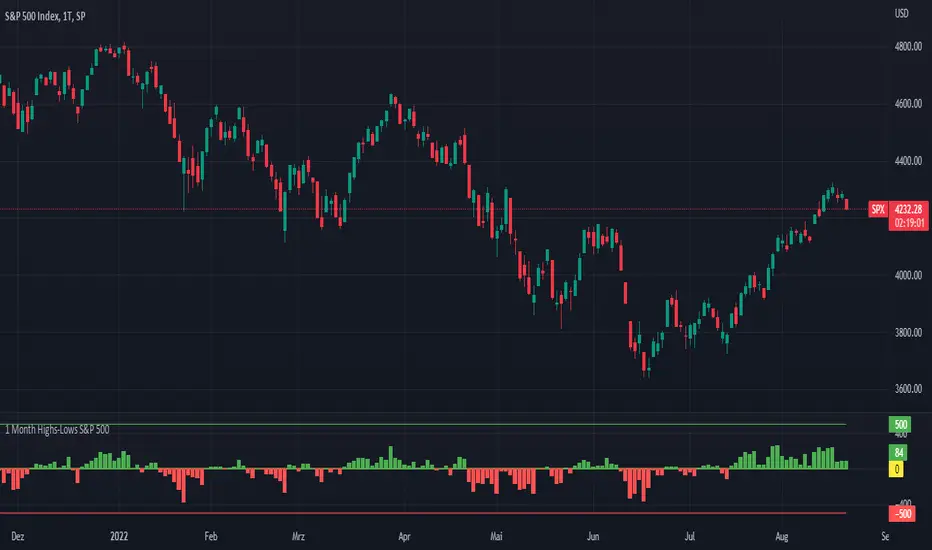
1 Month Highs-Lows S&P 500 - MugurThe script uses the M1HP and the M1LP index and subtracts the second from the first. So you can see how many stocks in the S&P 500 make new highs or new lows on a 1 month basis and see the trend of the market.
Volatility Trigger IndexThe script allows to assess the volatility of an asset.
It works by calculating the rate of change and the standard deviation.
The index is useful to determine the lowest volatility periods (could be useful to look strategies) and also it determine the highest volatility periods (maybe for exits or partial closes).
It has 3 iputs:
Lenght.
Low volatility value.
High volatility value.
The low and high values are set after a visual inspection. The values changes in each time frame. Usually when the timeframe is higher the value of the index is higher as well. So the low and high levels must be changed after each time frame set.
As an idea could be used in combination with any moving average to determine the market direction and the index used as a trigger.

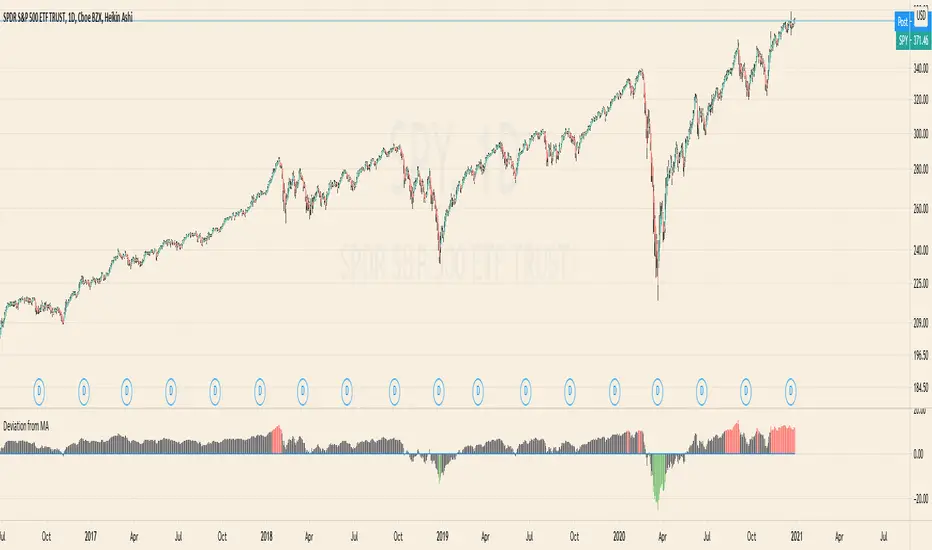
The DD investThe script tells me when to invest in the stock.
Split ur money into 3 piles. Each must be bigger than the previous one.
Buy with the first pile when the chart touches the middle line (SMA200).
Buy with the second pile when the chart touches the bottom line (lowest price of 200 weeks).
Buy with the third pile when the chart goes significantly below the bottom line (lowest price of 200 weeks).
Watch only the W1 chart (!!!).
Circles on the chart indicate places where you should buy (examples).
Consider selling half of the holding when the chart touches the top line (the highest price of 200 weeks).
Hold the rest much longer then you plan to ;)

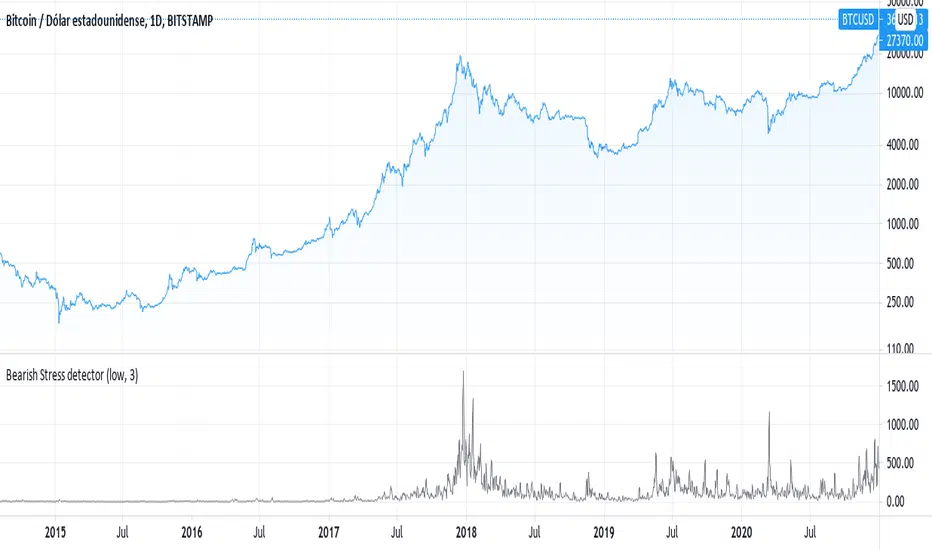
Detects the variability of the low price historyThe script uses the same technique that is used to measure the level of stress in humans, measuring the variation of the price instead of the variation of heart rate
RSI + Kijun/Standard Deviation on RSIThe script is inspired by Bollinger bands but instead of applying them on the price, they are applied on a RSI oscillator. The standard deviation is not plotted against the average like in normal BBs but instead is based on median values (equivalent of a Kijun in Ichimoku ). The goal is to better identify excess in prices that offer good entering points. The usage of a median provides a clearer view of ranging market (ie. the line will be flat).
I use it for long-term investments on stocks to find "fair" entry points. After picking a list of stocks of interest based on fundamentals, I switch to a weekly view. If the stock RSI is under the bands, it indicates that we are in favorable conditions for a buy. For an accurate timing, you can switch to the daily chart and watch out for either a break or a reintegration in the bands. This is your signal.

Deviation from MAThe Script calculates the Percentage Deviation to the MA and prints it as an Oscillator.
You can change the following Parameters:
Moving Average Type -> The type of the Moving Average you want to calculate the Deviation on
Length of MA -> The length of the MA
Percentage of Deviation (for Color) -> The Percentage Deviation above or below which the plotted Oscillator is painted in color.
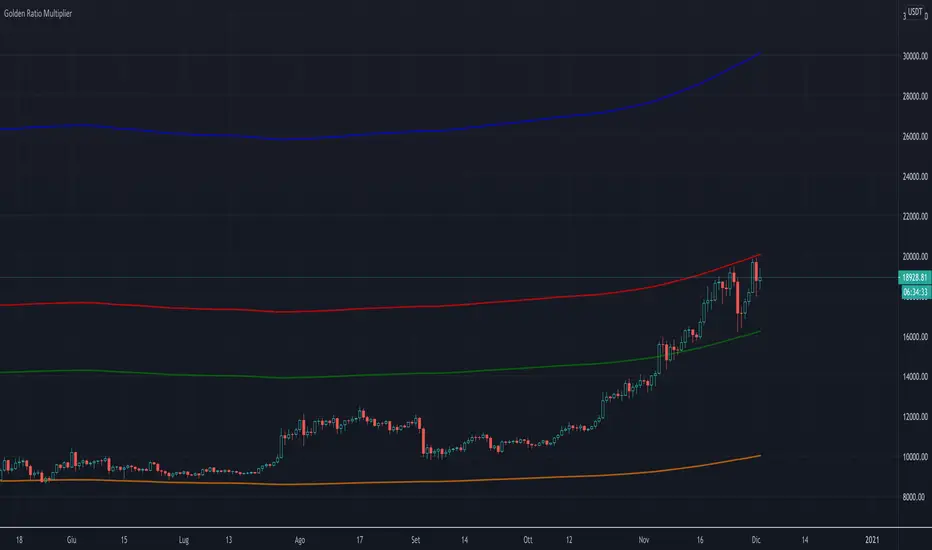
Golden Ratio Multiplier (x1.6; x2; x3)The script displays three multipliers (x1.618; x2; x3) of the Golden Ratio (starting with MA at 350 days) to identify the following levels of support:
the multiplier x1.618 is an accumulation high (green line)
the multiplier x2 is a support that identify a low bull high (red line)
the multiplier x3 is a support that identify an upper bull high (blu line)
Note: the orange line is the SMA at 350 days.
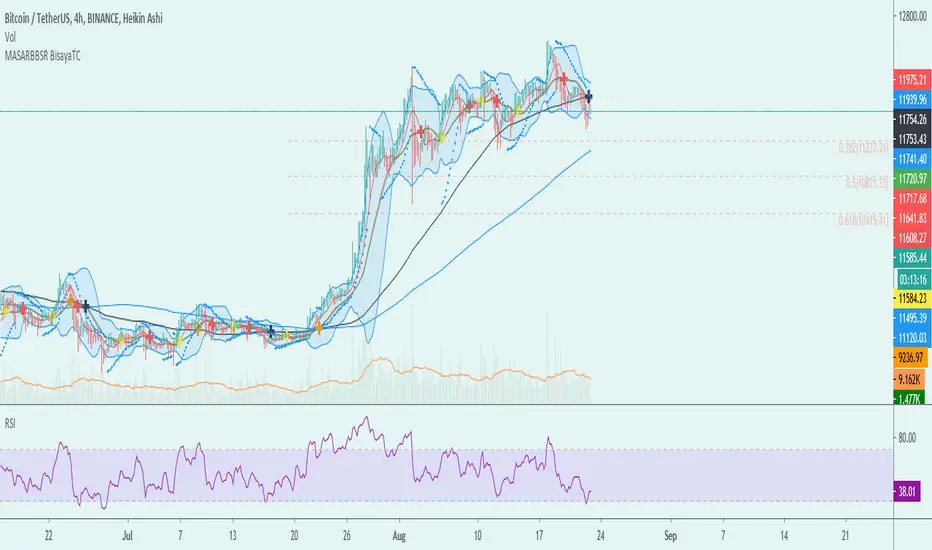
MA-SAR-BB-SR - BisayaTCThe script allows you to use multiple indicators such as Moving Averages, Parabolic SAR, Bollinger Bands, Support and Resistance and it includes alerts for each indicator.
MA - The moving average (MA) is a simple technical analysis tool that smooths out price data by creating a constantly updated average price. The average is taken over a specific period of time, like 10 days, 20 minutes, 30 weeks or any time period the trader chooses.
SAR - The Parabolic SAR is a technical indicator developed by J. Welles Wilder to determine the direction that an asset is moving. The indicator is also referred to as a stop and reverse system, which is abbreviated as SAR. It aims to identify potential reversals in the price movement of traded assets.
BB- Bollinger Bands are envelopes plotted at a standard deviation level above and below a simple moving average of the price. Because the distance of the bands is based on standard deviation, they adjust to volatility swings in the underlying price.
SR - Support and Resistance are certain predetermined levels of the price of a security at which it is thought that the price will tend to stop and reverse. These levels are denoted by multiple touches of price without a breakthrough of the level.
DISCLAIMER: For educational purposes only. Nothing in this content should be interpreted as financial advice or a recommendation to buy or sell any sort of security or investment including all types of crypto. DYOR
EMA 5/10/21 SMA 50/100/200The Script is mixture of both EMAs and SMAs. EMA 5/10/21 are powerful indicators for short term providing more weightage to the recent prices. SMA 50/100/200 provide the long term view.
5 Day EMA: This is a sign of strong momentum. It tracks the trend in the short term time frame. This is support in the strongest up trends. This line can only be used in low volatility trends with strong momentum. A break back above this line is a sign for me that an uptrend may be resuming. I primarily use it as an end of day trailing stop. It is rare that this line does not break intraday, even in the strongest trending markets.
• 10 day EMA: The 10 day EMA is a great moving average to use to keep you on the right side of the major market trend. It is usually the first line to be lost before any real trouble begins. It can be used as a standalone signal in some stocks and markets that tend to trend strongly in one direction for long periods.
• 21 day EMA: This is the intermediate term moving average. It is generally the last line of support in a volatile uptrend. To me, it is the inevitable reversion to the mean in a market when it finally pulls back after an extended trend.
• 50 day SMA: This is the line that strong leading stocks typically pull back to. This is usually the support level for strong uptrends. It is normal for uptrending markets to pull back to this line and find support. Most bull markets and uptrends will pull back to this level. It is generally a great “Buy the dip” level.
• 100 day SMA: This is the line that provides the support between the 50 day and the 200 day. If it does not hold as support, there is a high probability that the 200 day SMA is the next stop. This is the deeper pullback level in bull markets and uptrends. It usually presents a great risk/reward ratio in bull markets.
• 200 day SMA: Bulls like to buy dips when markets are trading above the 200 day moving average, while bears sell rallies short below it. Bears usually win below this line, as the 200 day becomes longer term resistance, and bulls buy pullbacks to the 200 day as long as the price stays above it. This line is one of the biggest signals in the market telling you which side to be on. Bull above, Bear below. Bad things happen to stocks and markets when this line is lost.

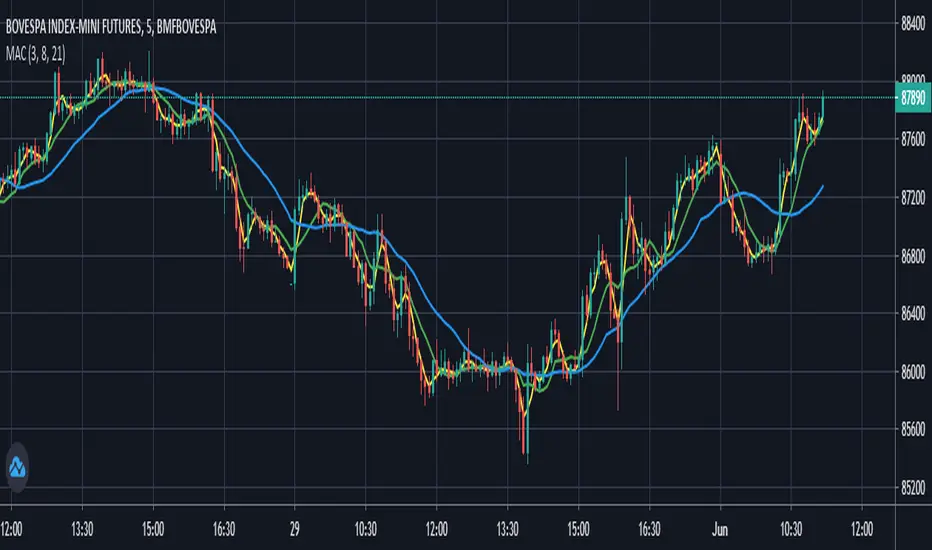
Moving Averages Convergence (Agulhada do Didi)The script is based on a strategy developed by Odir “Didi” Aguiar called “Agulhada do Didi”.
It consists in the use of 3 moving averages:
SMA 3
SMA 8
SMA 21
Strategy:
When the averages come together, preferably they pass through a candle, there is a signal. The crossing of the short average (3) with the long average (21) provides us with a confirma-tion of the entry.
Buy:
The average of 3 periods comes out on top, 8 goes in the middle and 21 goes down.
Sell:
Average of 21 periods comes out on top, 8 in the middle and 3 down.
Premarket High/LowThe script draws the high and low of the premarket session and based on these levels the ATR is added and also displayed on the chart as lines.
You can change:
- The Session Timeframe
- The ATR Multiple
- If the Aftermarket Session should be included

Algo & Dark Pool Activity - Find Hidden LiquidityThe script is designed to highlight potential algorithmic buying pressure and dark pool accumulation proxies on a TradingView chart. It overlays signals directly on price bars so you can visually spot when unusual activity may be occurring.


XAUUSD Fisher Transform Dashboard — Trend & Momentum InsightsThe script offers an educational visualization of trend and momentum on XAUUSD by combining the Fisher Transform with EMA direction. It plots momentum shifts, trend alignment, and includes a concise dashboard showing trend bias, the latest crossover event, and customizable percentage-based reference markers.
This tool is for market analysis and study purposes only and does not provide trading advice.

Breakout an Reversal Signal Detector with Colored in Bar TrendsThe script detects breakouts and/or reversals: when candles close outside the recent period high or low, it prompts a signal, indicating a change in market trend.
You can customize the bar color to indicate trending phases.
It can be used effectively to identify both breakouts and reversals, making it a versatile tool for trend and reversal analysis.
Simple yet effective.
Enjoy!

Vortag High/LowThe script displays the previous day's high/low during trading hours from 9:30 to 16:00 EST. This gives us a clean chart.

Scenario Screener — Consolidation → Bullish SetupThe script combines multiple indicators to filter out false signals and only highlight strong conditions:
Consolidation Check
Uses ATR % of price → filters out stocks in tight ranges.
Uses Choppiness Index → confirms sideways/non-trending behavior.
Momentum Shift (Bullish Bias)
MACD Histogram > 0 → bullish momentum starting.
RSI between 55–70 → strength without being overbought.
Stochastic %K & %D > 70 → confirms strong momentum.
Volume & Accumulation
Chaikin Money Flow (CMF > 0) → buying pressure.
Chaikin Oscillator > 0 (debug only) → accumulation phase.
Trend Direction
+DI > -DI (from DMI) → buyers stronger than sellers.
ADX between 18–40 → healthy trend strength (not too weak, not overheated).
Breakout Filter (Optional)
If enabled, requires price to cross above 20 SMA before signal confirmation.
📈 Outputs
✅ Green label (“MATCH”) below the bar when all bullish conditions align.
✅ Background highlight (light green) when signal appears.
✅ Info Table (top-right) summarizing key values:
Signal = True/False
MACD, CMF, Chaikin values

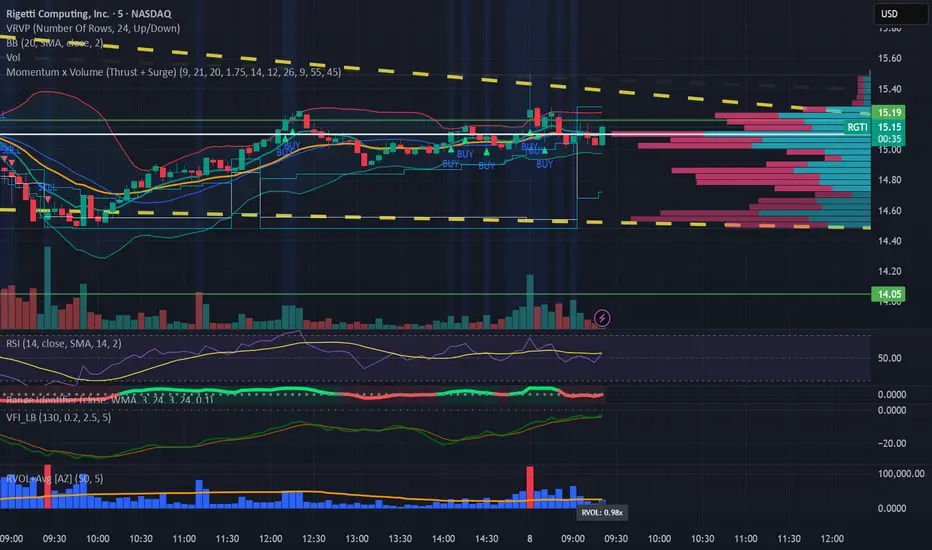
Relative Volume (RVOL) + Average Volume [AZ]The script helps you instantly see whether today’s volume is unusual compared to the past (relative volume). It’s built for breakout/fakeout filters, like the 15-minute ORB strategy you’re running.
Projected 65min VolumeThe script provides relative volume for the first 5min candle after its close vs 14 avg and estimates projected volume for the first 65min candle in the trading session vs avg value.
!!!The indicator is designed to work only at 5min TF!!!
